


The fishbone diagram is one of the pioneered tools used for quality management. In modern-day problems, many organizations or managers of the firms in the contemporary business environment fails to identify the real cause of the problems. Therefore, as a result, it will ultimately lead to the failure of the project or any operation of the business. Furthermore, in the field of construction projects, it has been observed that one of the major problems in this is related to the errors in the measurement process. The main issue in this context is to obtain optimal accuracy (Luca, 2016). Along with this, another observed issue in this field is related to errors in the evaluation of parts precision (Liliana, 2016). Likewise, there are several other problems that occurred in the construction project such as poor design, inconsistencies in time and cost management, etc. (Al-Zwainy et al, 2018) Moreover, it is also important to note that, quality is the primary factor of any business entity and any ignorance in marinating the quality of the product or service will lead to severe consequences in terms of loss of market share or customer dissatisfaction. Thus, there are a lot of challenges and issues in the management of quality of project delivery, product, or services that are being faced by most of the business entities on a daily basis. Thus, identifying the root cause of failure still remains one of the most challenging aspects in the domain of quality management.
The fishbone diagram, also known as the Ishikawa diagram, Herringbone diagram, and the cause and the effect diagram is one of the seven basic tools used for quality control. It is used to identify the root cause of the problems. Moreover, with the help of graphical representation, it helps the managers to visualize the relationship between effects and cause of the problems in a systematic way. Although, it was designed for the purpose of identifying problems related to business and management. However, gradually, it is now widely used in other fields also such as medicine, engineering, computer science, and others (Li et al, 2011).
Thus, the primary objective of this essay is to study how the fishbone diagram can potentially be used to analyze the root cause of the problems. The next section of this essay will discuss the application of the fishbone diagram in identifying the root cause of the stated problem. Furthermore, it also contains the advantages and disadvantages of using a fishbone diagram. Towards the end, the easy will reflect the essential findings of the overall discussions.
What Is A Fishbone Diagram And How To Draw It?
As per the analysis of Barsalo (2020), root cause analysis can be defined as a way to identify the real source of the failure of the project or product. This analysis is usually done to identify the right solution at a right time. The report of the same author suggests that the process of root cause analysis can be triggered by integrating a fishbone diagram or Ishikawa diagram. The Fishbone diagram derived its name from a Japanese professor, Kaoru Ishikawa; hence, it is also known as the Ishikawa diagram. It was developed in the year 1960 while getting served with the Kawasaki shipyards in the process of quality management (Rodriguez, 2020). Fishbone diagram uses brainstorming technique to point out the causes of the problems. All the findings are shown in the form of graphical representation. This graphical representation resembles the skeleton of the fish. The main causal categories are represented as bones attached to the spine of the fish. Thus, the way of representation of root-cause analysis resembles the skeleton structure of the fish; hence, it got its name as fishbone diagram.
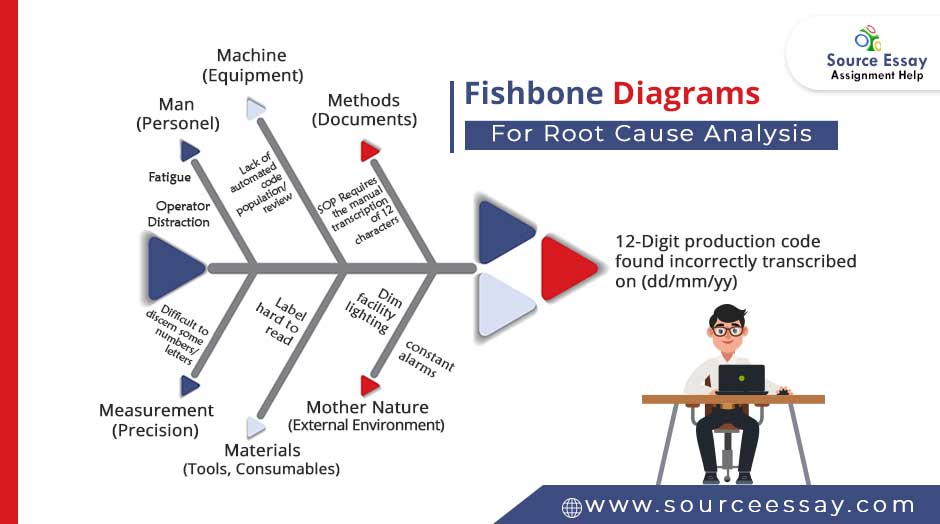
In the Fishbone Diagram help, the problems are represented on the head side of the skeletal diagram of the fishbone. The causes of the identified problems are represented as the bone of the fish extending to the left of the fish head. There are six main categories of the causes in the field of the manufacturing industry. These are the method, equipment, man, environment, material, and measurement. By the term method, the causes of the problems are related to the process or procedures used while working on a project. Equipment is related to the problems that occurred from the use of the machine in the process. Furthermore, in the context of man or manpower, the possible problems are identified and listed down. Likewise, the problems related to the environment or surroundings that results in the failure of the project are identified. The category related to material helps the team to identify the problems related to the use of materials in the overall process. Finally, the sixth category of the cause of the problem is measurement. In this context, the team tries to analyze the possible causes related to measurement such as errors, faults in measurement devices, etc. (Ishakawa, 1985).
Similarly, in the field of marketing, there are seven factors or causes that can lead to the failure of the marketing project. These seven factors are categorized as the product, price, place, promotion, people, positioning, and packaging (Lapaas, 2020). Any ignorance in any of the seven factors in the marketing of the product or service will lead to severe problems. Along with this, in the field of the service industry, there are five important factors that can effectively become the major cause of the problem in this sector. These five factors or causes are surroundings, suppliers, systems, skills, and safety (Usmani, 2020). The possible causes related to suppliers are lack of communication channel, false information, or human resource issues. Likewise, causes of the problems related to the system can be a system failure or lack of skilled operators. Thus, in the same way, there can be causes related to the identified that are drawn in the form of fishbone which ultimately helps the team to analyze the root cause of the problems in any industries.
Having discussed all the possible and probable categories of the causes of the problem, the main intention of this essay is to analyze how to conduct root cause analysis of the problem by using a fishbone diagram or Ishikawa diagram. Before this, it is extremely important to note that cause and effect analysis or fishbone diagram does not only help the business organization to identify the underlying source of issues or problems but it also helps them to develop a system in order to maintain sustainability towards the correction or solution. Moreover, it also enhances the operational activities of the business organization (Belyh, 2019).
In order to use a fishbone diagram for cause and effect analysis, it is important to first draw the structural framework of the model. It involves four steps to draw a fishbone diagram. These four steps are related to the identification of the problem, identification, and categorization of the causes of the problems, brainstorming of the main causes, and the analysis of the fishbone diagram. Thus, with the help of these four processes, the team of the business organization can effectively analyze the root cause of the problems that they were facing at the time of the execution of the business operations or projects
In the first step of drawing the fishbone diagram, the team of the business organization needs to identify all the problems that they are facing. Any industry, whether it is the construction industry, manufacturing industry, service industry, etc can use a fishbone diagram to identify the problem. All the problems, issues, and challenges need to be identified by the team. Along with this, the next important thing that needs to be done is to identify the time and place of the occurrence of the problem (Trout). Assignment helper said every detail of the problems should be mentioned by the team. The next step involves in this is to write the problem statement in a box and to draw an arrow towards it (Koripadu and Subbaiah, 2014). Apart from this, the problem statement should be in the form of an operational definition that will help the stakeholders to understand the problems clearly.
The second step to draw a fishbone diagram in order to conduct cause and effect analysis is the identification and categorization of the causes of the identified problems. It decides the major causes of the problems. In the structural model of the fishbone diagram, these causes and sub-division of the causes are needed to be placed parallelly from the main arrow stretched towards the left of the head of the fish or box (Harrington, 2016). In this step, the team of the business organization should categorize the problems by observing the type of problems. By asking questions like, Is any man is linked with the problems? Is there any problem with the machine used in the business operation? Was there any fault while measuring the results of the business operation? Likewise, it is important to discuss all the factors or causes of the problems in order to identify the real cause. For example, the causes of the problems related to the low quality of the product can be related to suppliers, materials, price, etc. In this way, the team needs to classify the causes of the problems. However, some critical care should be taken to identify the problems and their causes apparently. The goal and objective of the team should be clearly understood by all the team members (Rodriguez, 2020). To know more take assistance from university assignment help UK experts of SourceEssay.
The third step in the analysis of the cause and effect relationship by using a fishbone diagram is to brainstorm the main causes of each category of the cause. The causes of every category need to be drawn as twigs of the arrow of the categorical causes (Doggett, 2005). The team needs to brainstorm all the causes by asking twice and thrice, why it happens (Lynch, 2019). Apart from this, thinking of the five whys method will help the team to reach the root cause of the problems.
The final step in the development of a fishbone diagram is the analysis of the diagram from every possible perspective. After arranging the causes in their respective categories and completing the diagram, the next step is to discuss and examine each identified problem by the team in order to identify the root cause. In this step, further classification of the causes can be added depending upon the discussion and analysis of the diagram. To analyze it minutely, a team of the business organization needs to use multiple research methods such as surveys, focus groups, and interviews. This will also help the team and manager to investigate the case and its effects on the business of the organization. Moreover, it will also clarify how each cause or sub-cause is directly or indirectly responsible for the particular problems that are being faced by the team in performing business-related activities. On the basis of the identified root cause of the problem, the team can effectively identify the solution to the problem which will help to achieve the desired effect (Radziwill, 2017).
In the entire process of analyzing the root cause of the problem by using a fishbone diagram, the tool of ‘five whys’ is extremely important that ultimately provides immense support to the team to recognize the root cause of the problems. Study help promotes deep thinking ability among the team to solve the identified problem by recognizing its main causes (Serrat, 2009).
Application Of Fishbone Diagram In Analyzing The Root Cause Of Project Construction Delay
In order to understand how the fishbone diagram can effectively help the managers and team to analyze the root causes of the problem, this section of the essay will discuss its application. In the construction industry, one of the major problems faced by the project manager is project delay. Project delay is a severe problem that leads to adverse consequences in terms of cost overrun and poor quality (Mbala et al, 2018). With the help of the Ishikawa diagram or a fishbone diagram, the project team and manager can effectively analyze the root cause of the project delay by following the essential steps. Thus the problem has been identified already. Furthermore, the analysis of the research study of Septiawan and Bekti (2016) reflects that the possible categories of the causes of the problem of project delay are the method, materials, machine, measurement, and man. Each category of the cause has a direct impact on the project delay.
The brainstorming step helps to identify the main causes involved in each category. In the first identified category of the cause, that is method, the possible causes are related to late planning for piping, late site mobilization, unmatched technical bid evaluation with the requirement, late use of project execution procedure, and many more. Moreover, in the next identified category, the cause of materials is also contributing to delayed delivery of the project. For example, causes such as non-availability of detailed documents on time, late development of plot plan, late decision-making procedure, and lack of availability of materials on time are some of the potential reasons for the occurrence of the problem. A plot plan is a plan related to architecture, landscape engineering architecture, etc. It has been analyzed that it was delayed by nine months of the actual date of the submission of the plan. Likewise, causes related to machinery factors are late manufacturing and fabrication of materials. Materials such as carbon steel pipe, stainless steel pipe, control system, cable tray, and others were not ready on time. Furthermore, in the context of measurement, factors such as late development of project safety report, delayed data-sheet, late calculation, delayed report of oil and site investigation, etc are some of the major causes that are directly interlinked to the major problem of project delay. The final identification of the category, that is man, factors such as late reporting of the basic design of engineering, six-month delay in process flow diagram, five months delay in contract mobilization were some of the critical causes that created trouble for the project team. Further analysis of the fishbone diagram with the help of the Pareto chart implicates that the major root cause of the problem of project delay was ‘man’. Approx one-third of the factors are connected to the cause-category of man.
In addition to this, it can be affirmed that all the identified factors and causes of project delay show the relationship between one another (this relation is delayed time) which ultimately lead to one given situation-project delay (Abdel-Hamid and Abdelhaleem, 2019). Thus, cheap assignment help experts analyzed that how the fishbone diagram can significantly help the team to identify and analyze the root cause of the problem by following some critical steps.
Advantages And Disadvantages Of Using Fishbone Diagram For Analyzing The Root Cause Of The Problem
The application of the fishbone diagram in analyzing the root cause of the problem has already provided deep insights about its advantages and benefits in managing the project or development of the product by ensuring its quality. Identification of the root causes prevents the team to repeat the same mistakes again while working on particular business projects or activities. There are many advantages of a fishbone diagram such as it helps the manager and the team to develop a visual representation of the problem that establishes the links between the potential causes and their results on the business. Another advantage is that it demonstrates all the causes of the problem simultaneously. It also improves the decision making of the project team and helps them to determine possible actions to correct the problem (Castel, 2018). Along with this, the fishbone diagram prevents the team to adopt traditional thinking methods that will eventually distract the team members from the actual problems. In the traditional problem-solving methods, problems were solved without actually identifying the deep cause or source of the problem. Moreover, it provides temporary relief from the problem as it occurs again. Thus, the fishbone diagram method of root cause analysis effectively eliminates the traditional problem-solving methods. The technique of brainstorming is quite advantageous as it helps the team to engage in solving the problem (Belyh, 2019).
Paradoxically, along with several advantages of the fishbone diagram in analyzing the root cause of the problems, there are some disadvantages that need acute discussion. On one hand, brainstorming helps the team to draw possible causes of the problem; it can also result in loss of time and consumption of a lot of energy. Moreover, assignment writing help predicted it does not provide concrete facts and evidence of the problem; it is only a collection of multiple opinions of the team members. In addition to this, it is difficult to stay reliable on the fishbone diagram for big and complex projects as it contains a lot of causes and factors that managers may get confused to deal with the cause and effect relationship. Moreover, verification among the causal relationships is also inadequate in this technique of quality control (Bose, 2012). Another limitation is that the fishbone diagram cannot isolate the specific factors that are responsible for the problem (Islam et al, 2016).
The foremost intention of this essay was to evaluate how the fishbone diagram is effective in the analysis of the root cause of the problems. The discussion includes major categories of the causes of problems in three different sectors of manufacturing, servicing, and marketing. After this, it has discussed four major steps of analyzing the root causes of the problems including identification of the problem, identification of categories, brainstorming of the possible causes, and analysis. Further, it also provided evidence of the application of the fishbone diagram’s effectiveness in analyzing the root cause of the project delay. In this analysis, it has been observed that the categorical factor of ‘man’ is the main cause of the problem in the project delay in a particular construction project. In addition, the discussion of advantages has implicated that how a fishbone diagram is more effective than the traditional way of solving the problem. Thus, to conclude, it can be stated that the fishbone diagram technique of quality control is very influential and beneficial to manage the business projects; however, a clear understanding of its inappropriate implementation needs to be considered in order to avoid distractions and loss of time and energy.
Sourcelink- Sourceessay-
https://sourceessay.com/fishbone-diagrams-for-root-cause-analysis-fishbone-diagrams/


There are too many critical areas, including elementary insights, using the right equational gateway, performing the needful calculations, and the likes.
Even though one can use assignment expert to get over the challenges, it won’t allow them to develop key insights into the essentials of Mathematical calculations.This is why students look for online assignment help for fairer knowledge.
However, merely looking for digitized assistance or signing up with a random platform might not be fruitful.
You need to keep a couple of suggestive measures in mind and proceed with the rest of the essentialities accordingly.1.
Make sure that the firm has a reputation for offering flawless Math assignment assistance, at least for a period of 7-10 years.
See whether that the writers associated with the firm have extensive knowledge across the fundamentals of elementary algebra, statistics, calculus, and the likes.

Employee organisation followed by appraisal and employee retention are some of the objectives on a sustainable basis (Barnes, 2011).
The company has seldom received physically printed applications over post.The company sets certain deadline for receiving applications beyond which the task of checking the applications is done.
The HR manager and his departmental officers contact the shortlisted people over telephone or email asking them to appear for round of interview.
Get to know more from essay writing help of SourceEssayInduction And TrainingInduction and training are two crucial elements which help employees in any organisation to work conveniently and successfully.
Majority of the training is delivered to the operative as well as the middle level employees in regular succession.The Benefits Of The Induction And Training ProcessInduction and it training saves large volume of organisational resource.
This is the reason why it is important for the organisation to create a robust organisational culture which leads towards sustainability and sustains of candidates with the company.