


Learn about the different benefits of business intelligence visualization and how it can help you make better data-driven decisions for your company.
Most organizations across different domains are always ready to record data from their operations and their customer data since it aids in discovering patterns, and trends. Besides, 70% of organizations strongly believe that data visualization is a fundamental aspect of their growth and development.
The insights generated from data visualization play a vital role in making data-driven decisions that impact the success of businesses. The role of visualization in business intelligence has greatly expanded since the two work together to attain a uniform business objective. Visualization is all about presenting data in a simplified format to make it easy to understand.
However, you cannot deny the power of business intelligence on the milestones that have been attained within the business industry. This article sheds light on the importance of data visualization in business intelligence. Let’s get started!
Here’s Why Is Visualization Important in Business Intelligence
1. Enhances Data-Driven Decision Making
It is evident that any business meeting that mainly focuses on data tends to be shorter than those that purely rely on text and numbers. Data visualization makes it easier to develop a solution during discussion since they are guided by data-driven ideas. Business intelligence is mainly guarded by data visualization through generating actionable data insights.
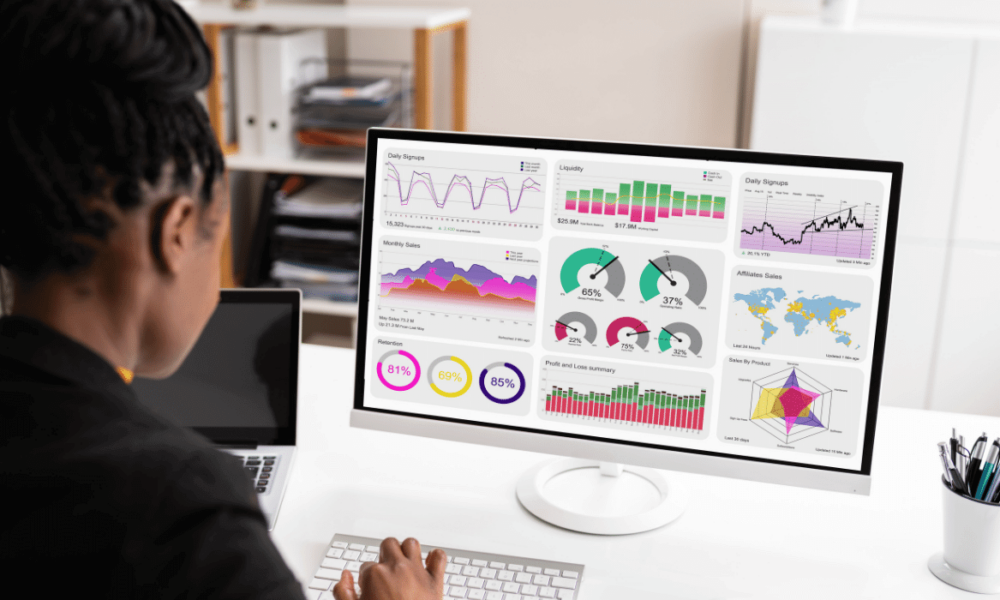
If you have installed the right data visualization systems in place, all your staff members enjoy gaining better and more actionable insights in the form of charts/graphs (Line chart, Pareto chart, Bar chart, Comparison charts, etc.) that enable them to understand the customer behavior and perceptions regarding the business brand. Note that data visualization combines creative storytelling and technical analytics to generate exciting data reports.
However, the visualization needs to properly suit your business goals to make it easier to attain significant milestones in business. Note that there are different types of data visualization that are used in data analytics, while others are used in the presentation of the data in an easy-to-read and understand format.
Some visualizations are mainly designed to showcase concepts, processes, and strategies you can use in decision-making. You can easily customize your preferred data visualization option to attain your goals in business.


The data received from the wearable devices that monitors your health to the large logistics and transportation company that checks the supply chain stocks, assets tracking all leads to a heap of Big data.
Analysing the data and predicting the future trend and where to focus more are some of the significant benefits it offers.
These smart data visualization tools and technologies helps to slice and dice the data to the minute granular level.
Let’s put on our technical hat in defining the IoT Data visualization techniques.
These real-time graphical data gives the passengers a hassle-free flight experience.
As said before, the big data collected from the various IoT devices, needs to be interpreted for analyzing them to take better business decisions.