


Google Analytics can tell you everything you need to know about your audience and site performance. If you have products or services to sell online, you need Google Analytics.
It will enable you to keep an eye on your Google shopping tracking, bounce rates, conversion rates, and landing page views. However, you may feel that your business deserves more. That’s where Ecommerce Tracking with Google Analytics comes in.
What Is Ecommerce Tracking in Google Analytics?
Ecommerce Tracking enables business owners to monitor and track shopping activity on their site(s). You can use Google Analytics for eCommerce Tracking to analyze and track transaction data, product/service performance, revenue, transactions, and cart abandonment rate.

Ecommerce Tracking in Google Analytics will help you to –
- Monitor products with high or low sales
- Track the conversion rate of your site
- Track the average revenue per transaction
- Observe the main trends in transactions and revenue over a fixed period
How do You Activate Ecommerce Tracking in Google Analytics?
13 Steps to set up Ecommerce Tracking in Google Analytics –
1. Sign up for a Google Analytics account, if you don’t have one.
2. Go to https://analytics.google.com/analytics/web/
3. Click on Admin in the bottom left-hand.
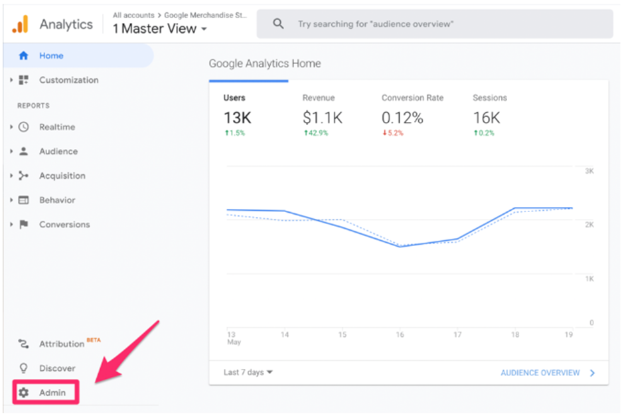
Source: https://www.crazyegg.com/blog/google-analytics/
4. Under the Property Column, click on Tracking Info
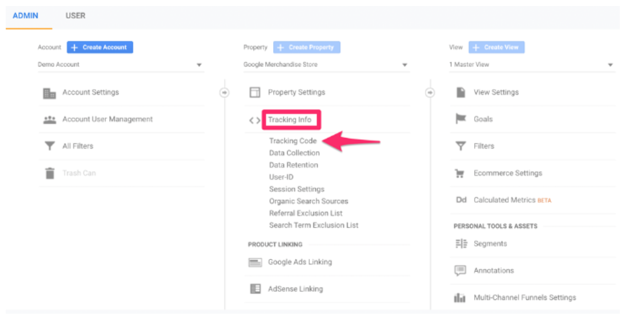
Source: https://www.crazyegg.com/blog/google-analytics/
5. Click on Tracking Code
6. Copy the Google Analytics Ecommerce Tracking code from the section under Website Tracking. You will receive a unique Ecommerce Tracking number (ID).
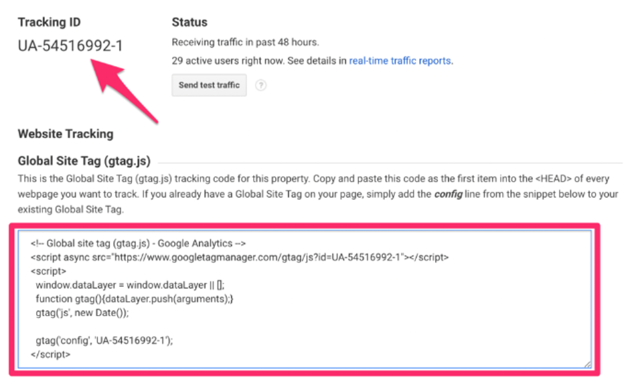
Source: https://www.crazyegg.com/blog/google-analytics/
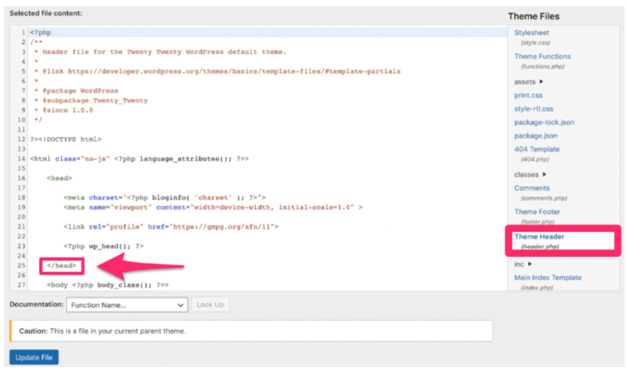
7. Paste the Google Analytics Ecommerce Tracking code on all the pages of your site in the head section.
8. Go to your website. Next, go to Real Time > Overview in your GA account.
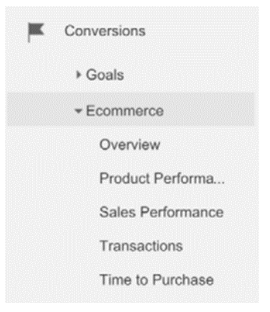
9. Go to Conversions > Ecommerce > Overview
10. Go to the Admin link once again.
11. Select Ecommerce Settings
12. Enable Ecommerce

13. Add the Google Analytics Ecommerce Tracking code and unique Ecommerce Tracking number (ID) to your website and send it to Google Analytics to receive complete reports. You may need the help of a developer if you are not familiar with HTML or JavaScript.
You have now successfully set up Google Analytics for Ecommerce Tracking in 13-easy steps.
Why Do You Need Ecommerce Tracking in Google Analytics?
Ecommerce Tracking in Google Analytics allows you access to consumer insights such as your target demographics, consumer behavior, product list, average clicks per visit, and whether a session ended with a successful purchase.
Track the Important KPIs
Ecommerce Tracking will enable you to understand the performance of your online store. You can monitor key performance indicators (KPIs), such as revenue, number of sales, and average order value.
- You will be able to gain quantitative data on your revenue per quarter or by each year.
- You can look at the significant drops or peaks in sales to find a trend.
- You can compare the revenue generated every week or month to the previous ones to generate new insights.
Track Sales from Multiple Channels
Using Google Analytics for eCommerce Tracking will enable you to track traffic and conversions from multiple sources. Google Analytics allows Google shopping tracking from various channels including social media posts, Google Ads, Facebook Ads, and Google search results (organic).

Go to Ecommerce > Acquisition > All Traffic > Source/Medium to check how each channel is diverting traffic and driving conversions on your site.
Boost Your Sales and Conversions Funnel
You can track how your website user behaviour reaches your website.
Go to Conversions > Ecommerce > Shopping Behavior to see how they move through your sales funnel.
It will give you a detailed summary of All Sessions, Sessions with Product Views, and Sessions with Check-Outs.
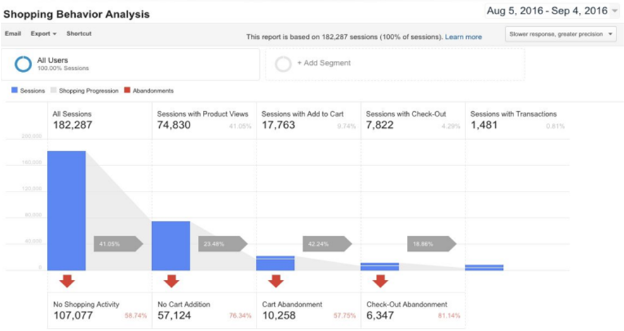
You can use these to create individual eCommerce segments. Utilize these insights to identify and address the customer pain points during their visits.
Tracking Shopping Cart Abandonment Rate
In the same summary, you will get to see the cart abandonment rate. It is typically a percentage of the sessions that resulted in cart abandonment.
This metric tells you how much revenue you are missing out on per week, month or quarter.
Monitor Product Performance
You may have just launched a new product, or are thinking of taking one off the market. First, you need to find out how these products are performing. For example, do you know –
- How many of the said products do you sell per week?
- How much revenue does it bring?
- Do customers leave it in their cart often?
- Do customers prefer buying it in bulk?
- How many of your visitors complete their purchase in one session?

Source:
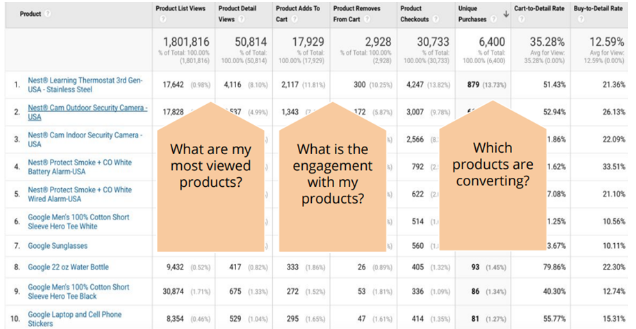
Google Analytics will allow you to view and analyze each product’s performance by their name or SKU. Go to Conversions > Ecommerce > Product Performance to get a comprehensive look at your product’s performance.
Monitor Product Revenue
In your product performance report, you can see your products sorted by Product Revenue. The report will give you a detailed summary of the percentage of each product that contributes to the total revenue of your site.
If you have Enhanced Ecommerce, you can also see the profits from each product category.
Track the Unique Purchases
The Unique Purchases metric under Ecommerce Tracking in Google Analytics shows the total number of times a product was a part of a transaction. It doesn’t show how many units of a particular product the site has sold. It only shows how many transactions it appears in each with its unique ID.
For example, if you have sold 150 units of Product X in 100 transactions, it means the product will show up in 100 transactions.
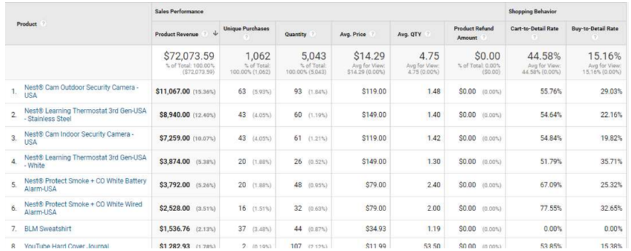
On the other hand, the Quantity metric shows how many units of Product X you have sold within a given period.
The Average Order Value
Ecommerce tracking in GA can help you determine your average order value (AOV).
AOV = Total Revenue / Total Number of Transactions
For example, your company has a total revenue of $15000 from selling 150 units of products. Therefore, the AOV is $15000/150 = $100
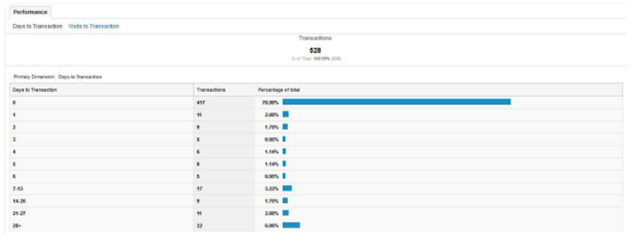
Time to Purchase
Standard Ecommerce reporting gives the users access to Time to Purchase. Go to Conversions > Ecommerce > Time to Purchase. You can view the total number of transactions for each period.
You can see how long the users took before making the purchase. It can help you understand how long your customers take to go through the funnel.
Source:
It may also help you determine if a percentage of your cart abandonments have a high chance of returning and buying the product in question.
What Can Webmaxy Do What Ecommerce Tracking in Google Analytics Cannot?
Google Analytics mainly focuses on quantitative data. And that’s not enough! You need to understand why your consumers buy only one unit of product X but multiple units of product Y. you want to know why you have a high bounce rate or cart abandonment rate.
You need to know what your consumers are looking at before deciding “this is enough. I need to check out the so-and-so website.” For that, you need real-time Ecommerce Tracking.
Webmaxy has the answers for you. Webmaxy offers real-time Ecommerce user tracking and recordings of each session.
You can see where your users are scrolling, where they are clicking, and why they are bidding adieu to your site.
Webmaxy user recordings are comprehensive. You can see clicks, hovers, zoom-ins, taps, and all mouse movements across multiple pages of your site. You can see if –
- The user is looking for more info after viewing a product.
- The user abandons the cart after shipment charges are calculated.
- They are visiting a particular page, or section before leaving.
- They are rage-clicking or flipping between multiple pages.
With Webmaxy and the state-of-the-art heatmap generating tools, you can determine –
- If you need new landing pages to captivate the audience.
- Whether your UX game is on point or if it needs an upgrade.
- The need for new product pages with more images and information to reduce the cart abandonment rate.
- The necessity for adding customer reviews to products to make your site more reliable for your new visitors.
Combining the insights from Ecommerce Tracking in Google Analytics with Webmaxy can give you the power to make a dent in the highly competitive eCommerce world.


Why Magento is the Right ECommerce Platform for ECommerce Startups.
Magento platform is totally free for you, available in two versions, namely Magento Community and Magento Enterprise.
Developers can do everything with Magento, from connecting the store with Google Analytics to payment gateways such as PayPal.
Magento is operated by a large extension library that allows users to customize the store by adding different features to the store.
USP of Magento is its eye-catching and user-friendly templates that make a user's visit to your online store fun and hassle-free.


"Call tracking software can be easily integrated with your Google Analytics account.
Calls can be reported to a Goal that you can create in Google Analytics.
In this blog, we will learn how to create a call goal for tracking calls in Google Analytics, how to create a goal for first-time callers, and view your calls report."

Top 10 Reasons Why to Start Using Google Tag Manager
Google Tag Manager (GTM) from Google is a tool that is free and it enables to incorporate various tags to your website.
Some Google Tag Manager examples include Google Analytics tracking codes, event codes remarketing tags, AdWords conversion scripts, etc.
In the comparison between Google Tag Manager vs. Google Analytics, initially the tracking codes for Google Analytics had to be hard-coded by a developer on every page, which made it cumbersome for larger processes involving hundreds of events.
Tag Manager solves this problem because it stores all tags at a centralized GTM account.
Adding and removing tags from the GTM interface is easy and fast.

Are you in search of an addition or alternative to Google Analytics?
Of course, but you are probably concerned about privacy, or possibly overwhelmed by how we can use Analytics.
Contact us today.For more, visit - https://appsshoppy.com/5-impactful-google-analytics-alternatives/

The primary thing I state to each new eCommerce entrepreneur is you will need to invest time in setting up an analytics tool.
While I would truly prescribe examination instruments to be the main device any site proprietor ought to introduce on their site, there are certain features that make them an absolute must on eCommerce sites.
In this article, I have found the top seven best eCommerce Analytics Tools.Pioneering the first bricks of your very own eCommerce store is thrilling, especially when being online is as trending as ever!
But those thrills come with challenges of gaining a competitive edge to survive and succeed.
So, getting insights for your e-store from a lucrative Analytics Tool is more of a necessity than just a choice.
Getting a better idea and making relevant changes about how your audiences are responding to y.our offerings help you in coming across as a trusted online entity.


