


7 QC Tools For Quality Improvement With A Strategic Plan
“As much as 95 percent of all quality-related problems in the factory can be solved with seven fundamental quantitative tools.”
-Kaoru Ishikawa, The inventor of the Fishbone Diagram
In today’s customer-centric market, quality is an integral factor in the growth and sustainability of any business. Businesses go the extra mile to provide the best and most excellent customer experience to ensure customer satisfaction. Hence, efficient quality management which has the highest impact on customer experience is one of the most essential features for any business.
Introduced by Kaoru Ishikawa, the seven basic tools of quality also known as 7QC tools are very effective in quality management and quality assurance process. So, businesses who want to ensure the competitive and excellent quality of their products and services can utilize the proven 7QC tools for structuring a strategic plan for quality improvement. Know the Details List Of 7QC Tools.
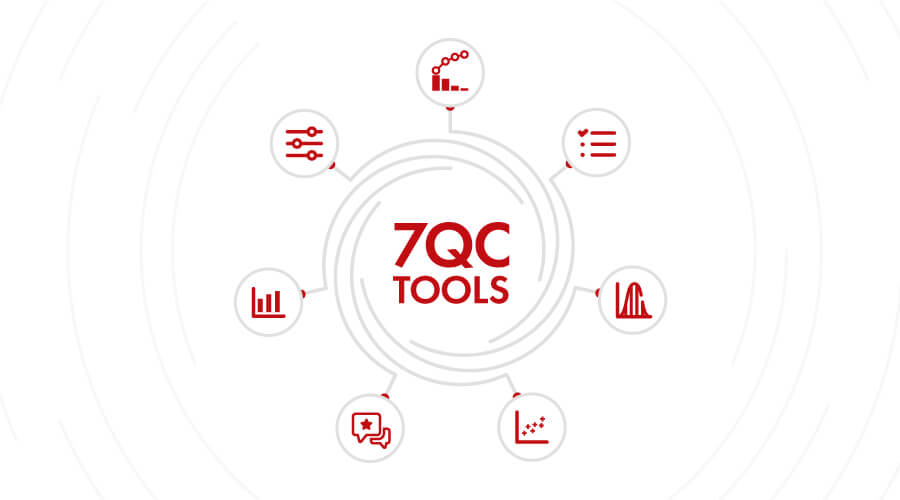
LIST OF 7 QC TOOLS
Cause and Effect Diagram
Cause and Effect Diagram also known as Fishbone Diagram helps in identifying the potential causes of an effect or a problem. In addition to sorting ideas in respective categories, it also helps in understanding the areas of opportunity through effective brainstorming. Fishbone training empowers you to identify the potential cause in the problem.
Control Chart
Control charts are used to study how the processes have changed over a period of time. Further, by comparing current data to historical control limits, one could lead to the conclusion about whether the process variation is consistent as in under control or unpredictable as in out of the control due to being affected by special causes of variation.
Pareto Chart
Pareto Chart is based on the 80/20 rule where it shows the significant factors that have the highest impact on the identified problem.
Check Sheet
Check sheet is a structured process which helps to collect and analyzing data. It is an effective tool that can be for a variety of purposes.
Histogram
Histogram is commonly used a graph that shows the data and its frequency of distribution to help users identify each different value in a set of data occurs.
Scatter Diagram
Scatter diagram shows the relationship between two important factors i.e. pairs of numerical data, one variable on each axis to demonstrate the relationship.
Stratification
Stratification also known as a flow chart or run chart is a technique that separates the data gathered from a variety of sources so that patterns can be seen i.e., the path an entity has taken through a defined process.
Utilizing the 7 QC tools in six sigma or the quality management process helps in taking a systematic approach to identify and understand the risk, assess the risk, control fluctuation of product quality and accordingly provide solutions to avoid future defects.


