


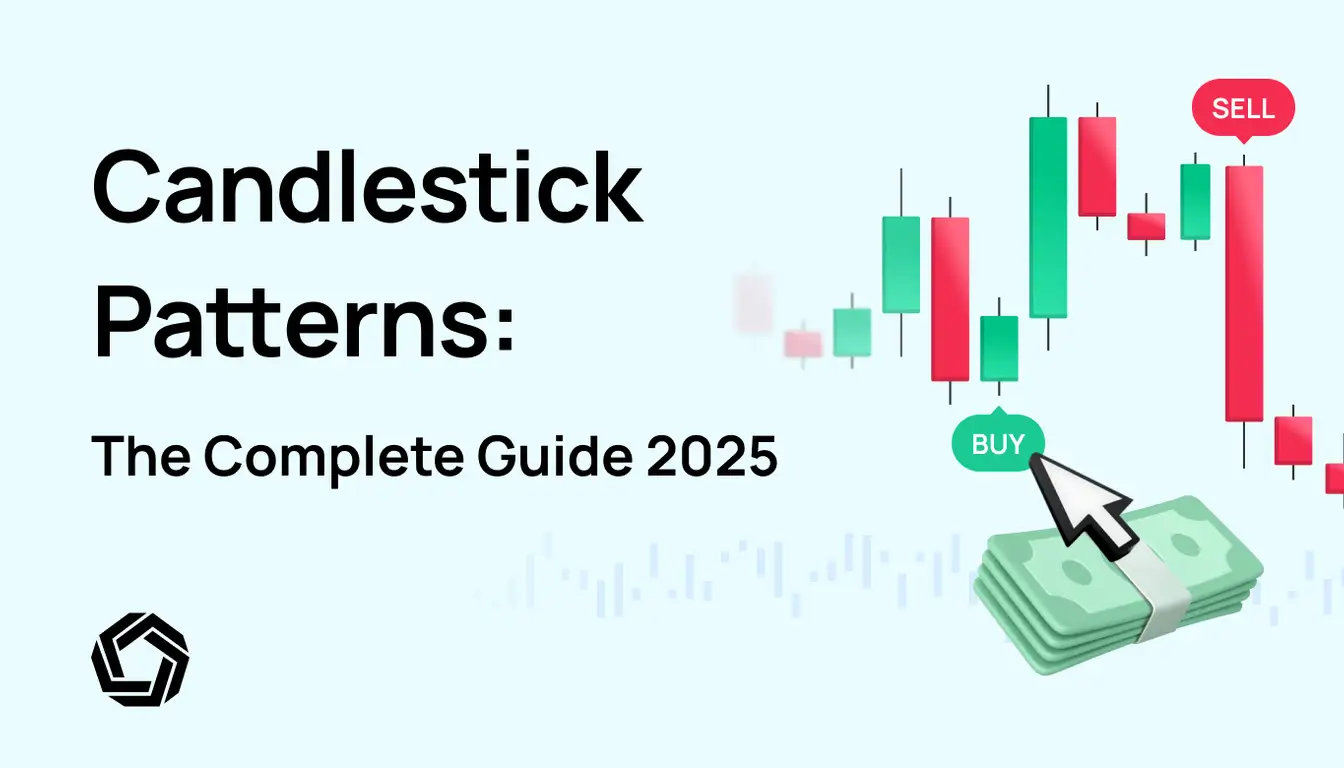
Candlestick pattern analysis is one of the most powerful tools for traders in the stock market. Used for centuries in Japan and now a cornerstone of technical analysis worldwide, candlestick charts help investors understand price action and predict market trends.
Whether you’re a beginner or an experienced trader, learning candlestick patterns can improve your decision-making and give you an edge in the market.
What Is a Candlestick Pattern?
A candlestick pattern is a charting style that shows the open, high, low, and close prices of an asset within a specific time frame. Each candle represents a trading session, and its shape reveals whether buyers or sellers dominated during that period.
Body: The difference between opening and closing prices.
Wick/Shadow: The highs and lows during the session.
Color: Green/white indicates bullish (up), while red/black shows bearish (down).
By combining candles, traders identify candlestick patterns that signal possible reversals, continuations, or indecision in the market.
Types of Candlestick Patterns
Candlestick patterns fall into two broad categories:
1. Bullish Candlestick Patterns
These indicate a potential upward move. Popular bullish patterns include:
Hammer: A short body with a long lower shadow, signaling potential reversal after a downtrend.
Bullish Engulfing: A large green candle that fully covers the previous red candle, showing strong buying interest.
Morning Star: A three-candle pattern suggesting the end of a bearish phase.
2. Bearish Candlestick Patterns
These suggest a potential downward move. Common bearish signals are:
Shooting Star: A small body with a long upper shadow, often after an uptrend.
Bearish Engulfing: A red candle that completely engulfs the prior green one, showing sellers taking control.
Evening Star: A three-candle pattern signaling the end of a bullish trend.
Why Are Candlestick Patterns Important?
Quick Insights: Candlestick patterns provide instant visual clues about market sentiment.
Trend Reversal Signals: Help traders spot potential turning points.
Entry & Exit Planning: Used to time buying and selling decisions.
Widely Used: Accepted by traders across stock markets, forex, and crypto.
Limitations of Candlestick Patterns
While candlestick patterns are powerful, they aren’t foolproof.
They work best with other tools like moving averages or RSI.
Patterns may fail in highly volatile markets.
Relying only on candlestick patterns can lead to false signals.
How to Use Candlestick Patterns Effectively
Confirm with other technical indicators.
Always check trading volume before acting.
Practice on historical charts to build confidence.
Combine short-term candlestick signals with long-term trend analysis.
Understanding candlestick patterns is essential for anyone serious about trading. They help decode price action, reveal market psychology, and guide smarter decisions. While not 100% accurate, candlestick pattern analysis—when combined with other strategies—can significantly improve your trading results.




Happy Friday, Traders, Investors, Analysts!!!!
This week was full of surprises and drama for US Stock Market.
We haven’t received the results of Election 2020 and other hand market has rebounded from last couple of week’s fall.

National Stock Exchange (around 2000 companies listed) and Bombay Stock Exchange (around 5000 companies listed).
1 to the high of Rs.
Also, note the broker will charge you brokerage charges and certain mandatory government taxes.
Though this question has been asked by those who wish to start investing in the stock market, it might have crossed others’ mind too who are sitting on the fence, and who have small regular savings.
It is suggested that you buy minimum shares of 15 to 20 different companies representing different sectors/industries so that you build up a diversified portfolio.
By diversifying your portfolio you are actually minimizing (spreading) the risk that you can take, as share market is volatile.