


William J.O'Neil, an American technician in one of his books, named "How to Make Money in Stocks," defined Cups and Handle. A cup with a handle shaped chart indicating the flow of trend is termed as Cups and Handle technical chart pattern. Let's be more practical and look at the cup you daily drink tea/coffee in. That's the same way a Cups and Handle chart pattern appears, considered a bullish signal; the pattern formation could be short or long. This type of bullish signal is used to spot the opportunities in the long run.
The old technique has evolved more with time, adding more patterns in all time frames. But, still, some of the traders adhere to O'Neil's rules.
What do they say ?
A stock forming pattern indicates a trend, and with a Cup and Handle, the uptrend could be known. The pattern shows the incurring selling pressure from investors who bought them previously. The selling pressure makes price consolidate with a tendency of the downtrend for days or weeks before it booming high. The chart pattern helps in identifying the buying opportunities.
Things to keep in mind when observing Cup and Handle pattern:
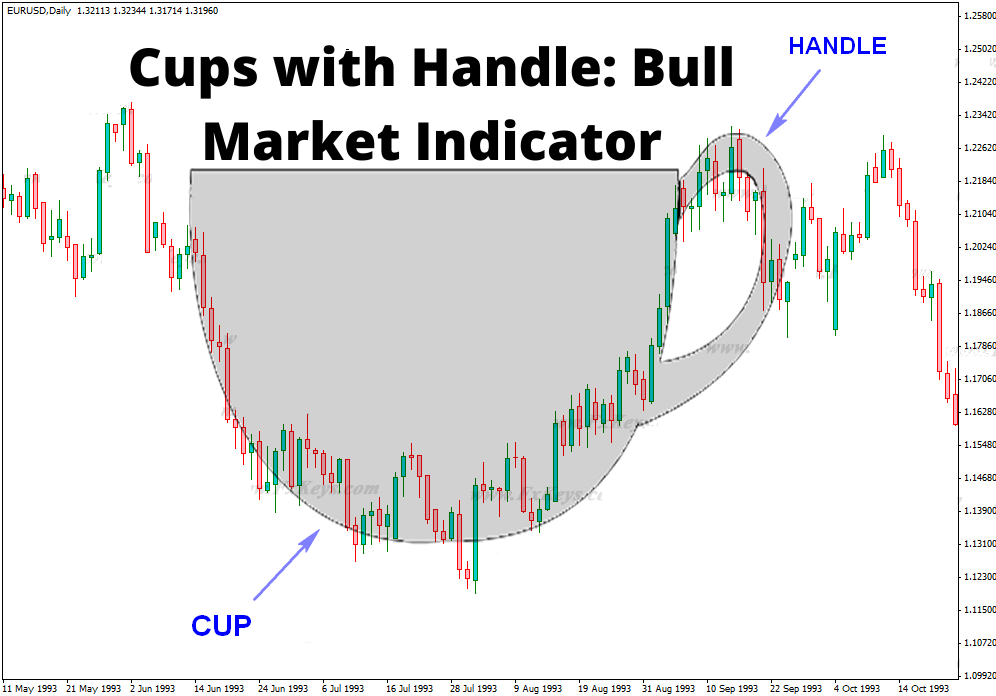
- Cups with long ‘u’ indicate a strong signal to invest. ( V shape should be avoided)
- The handles should not be more than one-third of the cup; more deep handles should be neglected.
- The handle should be formed at the top and not at the bottom.
- Volume should decrease with price and increase when the price goes higher.
- Volume should be at the base before starting to rise again.
- The price increases when stock again moves towards a high trend as the previous high.
- The further away the handle is from the highs, the more significant the breakout point needs to be.
- Stop buy orders should be placed slightly high from the handle.
- Observe and study the pattern
- Analyse
How does the Candle and Handle Pattern work?
A stock pattern should be analysed carefully; if in the study of the pattern you find a long ‘U’ formation, then stop and examine. The shape formed should resemble a cup with equal highs on both sides of the pattern. However, after the highs on the right-hand side of the cup, there is a sudden low and up high again forming the handle. The handle represents the consolidation before the breakout point. The handle should not be more than one-third of the cup.
A breakout is just above the handle formation when the trend starts to move upwards. This uptrend earns profits for investors. The breakout should occur with an increased volume. The trend should not be too mature, as it decreases the chance of a breakout point.
The target is the estimate of the advance by calculating the distance between the bottom of the cup to the right side top.
For instance, an asset cup forms between $89 to $90, then the handle formation should be around $90 to $89.6. Therefore, the handle is one-third and not more, or the profit is erased.
Stop-Loss and Target
A stop-loss is required when the stock price is expected to rise after the handle formation, but the stocks move sideways or rise and fall. Stop-loss helps traders come out of the trade after the sudden fall of stocks. In addition, they are serving as a risk controller by selling the position.
Place the stop-loss below the bottom of the handle when the prices fluctuate up and down a lot. If the stop-loss is below the halfway point of the cup, then the trade should be avoided. Stop-loss should be in the upper third part of the cup to manage the risk.
Target is the double of the cup height; when cup height is added to the breakout point of the handle, it becomes the target. So, for example, if the cup forms at 50 to 51 and the breakout point is 51, then the target would be 52.
When the sides of the cup are different, smaller heights should be taken for conservative targets and larger ones for aggressive targets.
Stop-loss represents the risk and target the rewards.
Limitations of Cup and Handle
Cup and handle is an old technique that requires some changes with time. It has some drawbacks; firstly, the trader has to wait for the entire formation of the pattern, leading to late decisions. Second, the pattern forms, and if the trader quickly decides without analysing, then this quick move could come out as an expensive one—a time-consuming process as it takes a day, month or year. Lastly, Cup and Handle could be pretty unreliable patterns in non-liquid stocks.
Conclusion
A chart pattern with lows and highs, Cup and Handle, is a technical way of calculating the stock price. It is a reliable way to know about the trends of the stock market. A trader needs to regularly observe the pattern and have a good understanding of stocks. The market is volatile, leading to ups and downs every moment, so have a deep knowledge of the chart pattern. Though it has some drawbacks, there is still no better pattern to read the uptrend and earn profits quickly. Regular observation of the stock market and practices saves the trader's time and increases the power of quick decisions. An excellent source to have the technical knowledge and gain profits.


Whatever he touches turns into gold.
As making predictions about long term investments are comparatively more comfortable than making predictions in short-term investment.
Some More Experts’ Stock Trading TipsStock Trading Tips 1: Manage the risks through focusInvesting is right when the right amount of focus is laid on managing probable or threatening risks that can siphon off profits.
Stock Trading Tips 4: Think for Longer-Term It isn’t easy to comprehend, consider and foresee the entirety of the powers that influence markets to move by taking small steps.
If you need to find out about investments, the ideal way is to discover a coach that can show you what occurs.Stock Trading Tips 6: Be Patient by David BakkeShow restraint.
Take a gander at a bigger-term execution of a specific investment (ranging between 5 to 10 years) as opposed to the short-term implementation.Stock Trading Tips 7: Remember to Roll Over by Jon Stein.While you’re at business, the business frequently gives administrative charges identified with support and unprecedented keeping of the four hundred and one thousand plan.

Foreign exchange is a global market that is incredibly liquid with enormous trading volume.
Before jumping in forex trading, there are various unique advantages of forex trading over other financial markets that every trader must know.Top 11 Advantages of Forex TradingHere in this article, we are going to focus on some unique advantages of forex trading.1.High LiquidityThe foreign exchange market is the most liquid market in the whole world.
In the world of finance and high forex, liquidity indicates the easier movement of money in and out with little price difference in buy and sell prices.
But this could turn into a great disadvantage as well because the price movement can happen on any side.
Here are some currency pairs which are more popular than others.Minor Pairs: SGD/JPY, USD/ZAR, and CAD/CHFMajor Currency Pairs: EUR/USD, GBP/USD, and USD/JPYExotic Pairs: TRY/JPY, EUR/CZK, and USD/MXNEmerging Currency Pairs: EUR/RUB, USD/CNH, and AUD/CNHYou can trade in all these currency pairs with a trading account.4.24/5 AvailabilityTrading in the forex market is a continuous process because it is a global market, and if a market closes in one country then somewhere in the world a new market opens in another country.
Spread is the difference between the asking price and bid price.For example, in a forex trade selling price is 1.3428 and buying price is 1.3427, then the spread for this transaction is one pip.Some brokers also charge a commission on the transaction.