


As soon as you log in to your AlohaABA account, you find yourself at the dashboard. This area is customizable and is organized to show you tiles with various business insights.
Notice that metrics like aging reports and a billing summary are central in the dashboard for you to keep track of these things. The use of color-coding allows you these important metrics to be salient to you as you log in.
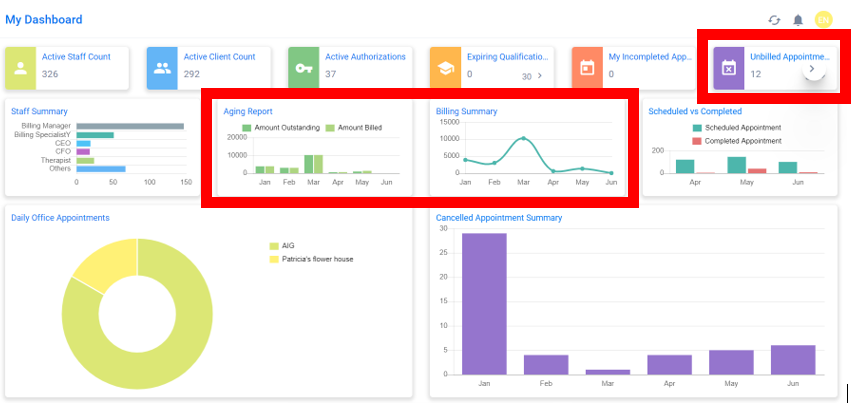
Keep track of key metrics related to the billing cycle using the dashboard. AlohaABA’s dashboard helps you manage your revenue cycle by forecasting financial health and success so you can make the right decisions to manage your business well and continue to serve your clients well.
How often are you examining the metrics of your business such as aging reports? You’ve got a lot going on and it can be inefficient and time consuming to be reviewing multiple Excel spreadsheets with your financials.
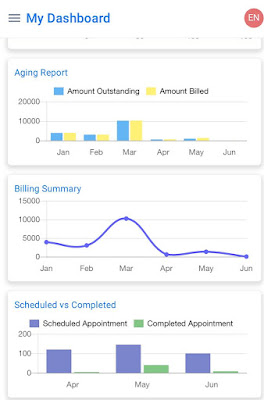
Notice how easy it is to see the important metrics that you need to keep an eye on, even on a mobile device. If you’re heading between clients or sites, easily take a moment to check your data and always have your pulse on the financial health of your business.
Run customizable reports that focus on the relevant information needed to manage your business. Having the reports automatically generated for you is so much easier than turning Excel graphs into PDFs and compiling for leadership meetings.
Check out our full blog : Managing insurance claims Efficiently with Smart ABA Practice Management software, to know more about the advantages an ABA practice management software can bring to your practice.


