


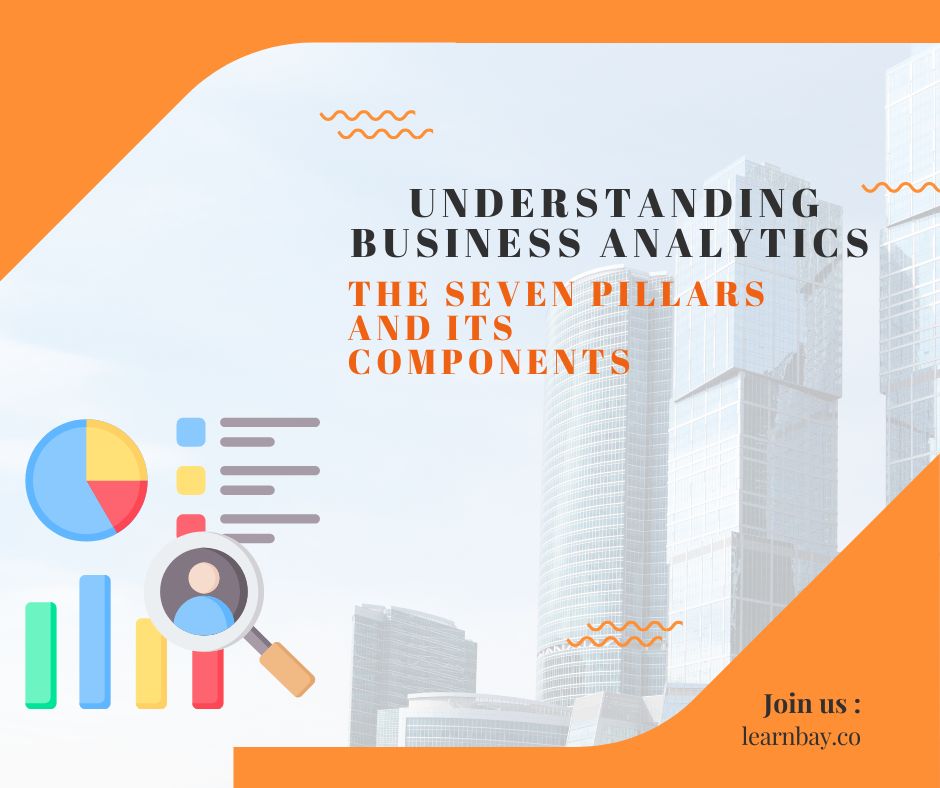
Introduction
Businesses today depend more on insights and useful intelligence to help them make wise decisions in a data-driven world. Analytics in business are useful in this situation. Business analytics refers to a collection of approaches, tools, and procedures that enable organisations to use data to generate insightful knowledge and guide strategic decision-making. The definition of business analytics, its key elements, and the seven pillars that support this discipline's foundation will all be covered in this article.
What is Business Analytics?
Business analytics is the process of analysing data using statistical techniques to find patterns, derive valuable insights, and make decisions based on that data. It entails the investigation, interpretation, and transformation of data into useful insight in order to solve complicated business issues, improve operations, boost productivity, and spur innovation.
Major Components of Business Analytics
Data Collection and Integration: Business analytics' first step is to gather pertinent data from a variety of sources, such as internal databases, consumer interactions, social media, sensors, and external datasets. The combined and altered data is then presented in a structured style for analysis.
Data Storage and Management: Business analytics must include effective data management and storage techniques. Organisations may store and retrieve enormous amounts of organised and unstructured data using centralised repositories like data warehouses and data lakes. Data security, compliance, and quality are all ensured by data governance practises.
Data Analysis and Exploration: Utilising a variety of analytical methods to study and comprehend data is part of this component. Analysing historical data with descriptive analytics allows for the understanding of prior performance. Deeper analysis is used in diagnostic analytics to pinpoint the origins of particular results. Prescriptive analytics suggests the best courses of action, while predictive analytics forecasts future trends using statistical models and machine learning algorithms.
Data Visualization and Reporting: Data visualisation technologies turn complex data into understandable charts, graphs, and dashboards. This makes it possible for decision-makers to quickly understand insights and grasp information. Reports and dashboards make it easier to track key performance indicators (KPIs) and the advancement of corporate objectives.
Statistical Analysis and Modeling: Data interpretation, relationship discovery, and hypothesis validation are all tasks of statistical analysis, which employs mathematical models and algorithms. A few often employed methods are time series analysis, clustering, decision trees, and regression analysis. Based on past data, statistical modelling enables firms to forecast future events and streamline operations.
Business Intelligence and Decision Support: Business intelligence solutions give organisations a comprehensive perspective of business operations, helping them to spot patterns, track progress, and seize opportunities. Decision support systems incorporate analytics into the decision-making procedure, offering perceptions and suggestions to direct strategic decisions.
Data-driven Culture and Strategy: Adopting a mindset that views data as a strategic advantage includes building a data-driven culture. It requires creating precise data-driven goals, coordinating analytics projects with corporate goals, and fostering a culture of ongoing learning and experimentation.
The Seven Pillars of Business Analytics
Data-driven Decision Making: Driving decision-making across all organisational levels with data and analytics.
Predictive Analytics: utilising statistical modelling and machine learning techniques to predict future trends and results.
Optimization and Simulation: utilising simulation models and mathematical optimisation approaches to find the best solutions and test situations.
Data Visualization and Storytelling: Using visual data presentation to successfully communicate insights and tell engaging tales that connect with stakeholders.
Managing the performance of a business: Tracking progress towards organisational goals through performance management and monitoring utilising metrics and key performance indicators (KPIs).
Risk Management: improving corporate resilience and making wise risk-related decisions by identifying, evaluating, and managing risks through the use of analytics.
Data Governance and Ethics: creating rules, practises, and controls to guarantee data security, privacy, and compliance with legal requirements.
Conclusion
In today's data-driven world, business analytics has emerged as a crucial discipline for organisations looking to gain a competitive advantage. Organisations can gain important insights from their data by utilising the core elements of business analytics, such as data collection and integration, data analysis and exploration, and data visualisation and reporting. Additionally, the seven business analytics pillars—such as data-driven decision making, predictive analytics, and risk management—offer organisations a complete framework for implementing data-driven decision making, streamlining operations, and staying competitive in a market that is rapidly changing. If you want to learn more about Business Analytics and its concepts, visit Learnbay’s Business Analytics Course, taught by industry tech leaders.


