


In the vibrant world of data science, the journey from raw data to actionable insights is a craft — an art and a science. At Brainalyst, we simplify this craft, guiding you through the data analytics lifecycle and explaining the pivotal role of Exploratory Data Analysis (EDA) in data science.
The Data Analytics Lifecycle: Your Roadmap to Insights
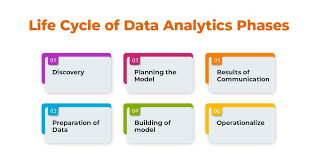
Imagine you're a detective, and data is your case file. The data analytics lifecycle is your investigation process — a series of steps that transform clues into conclusions.
- Question Phase: Like any good sleuth, start with the 'what' and 'why'. What are you trying to understand or predict? Why does it matter?
- Data Wrangling: Gather your evidence. Collect data from various sources and cleanse it, preparing for thorough examination.
- Exploratory Data Analysis (EDA): This is your magnifying glass. Delve into the data, searching for patterns, anomalies, and correlations. EDA in data science is about asking the data to reveal its secrets before making any formal hypotheses.
- Model Building: Develop your theories — or in data terms, your models. Use statistical models to test your hypotheses and predict outcomes.
- Validation: A good detective confirms their theories. Validate your models using new data sets to ensure they hold up.
- Deployment: Share your findings. Put your validated model into practice, and watch as your insights influence decisions.
- Feedback: The case may be closed, but the work doesn't stop. Gather feedback, learn from the outcomes, and refine your process for the next case.
EDA in Data Science: The Heartbeat of Discovery
Exploratory Data Analysis is not just a step; it's the heartbeat of the whole lifecycle. It's where intuition meets data, where visuals like graphs and charts help narrate the story hidden within numbers. EDA is about understanding the nature of your data without making assumptions. It's about finding the story the data wants to tell.
- Visual Tools: Use charts, plots, and heatmaps to visualize data. These are your lenses to see the bigger picture.
- Statistical Summaries: Summarize data using means, medians, and modes — the synopsis of your data story.
- Pattern Recognition: Look for trends and patterns. They're the recurring themes in your data narrative.
Brainalyst: Your Guide to Data Mastery
At Brainalyst, we believe in making the complex simple. Our tools and courses are designed to walk you through the data analytics lifecycle with ease, making EDA in data science an accessible and exciting exploration.
We equip you with the skills to perform EDA effectively, ensuring that by the time you reach model building, you’re not just working with data — you’re telling its story. Brainalyst is here to help you become a master of the data narrative.


