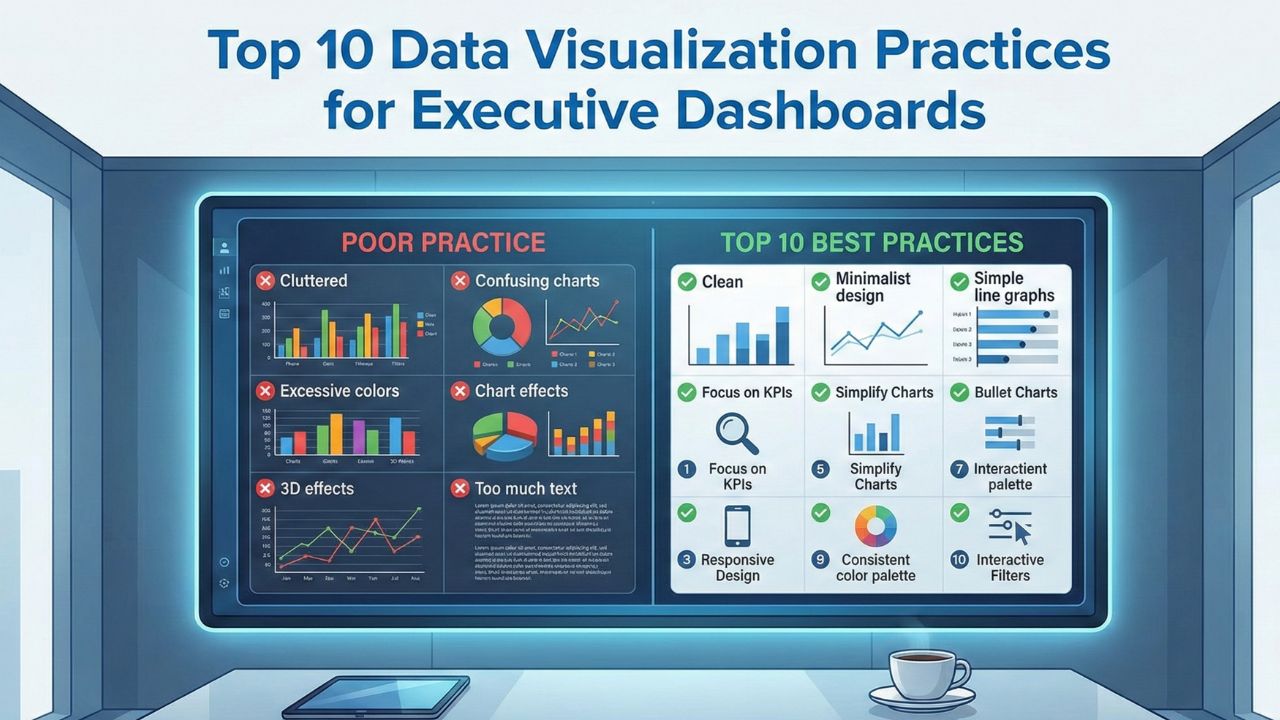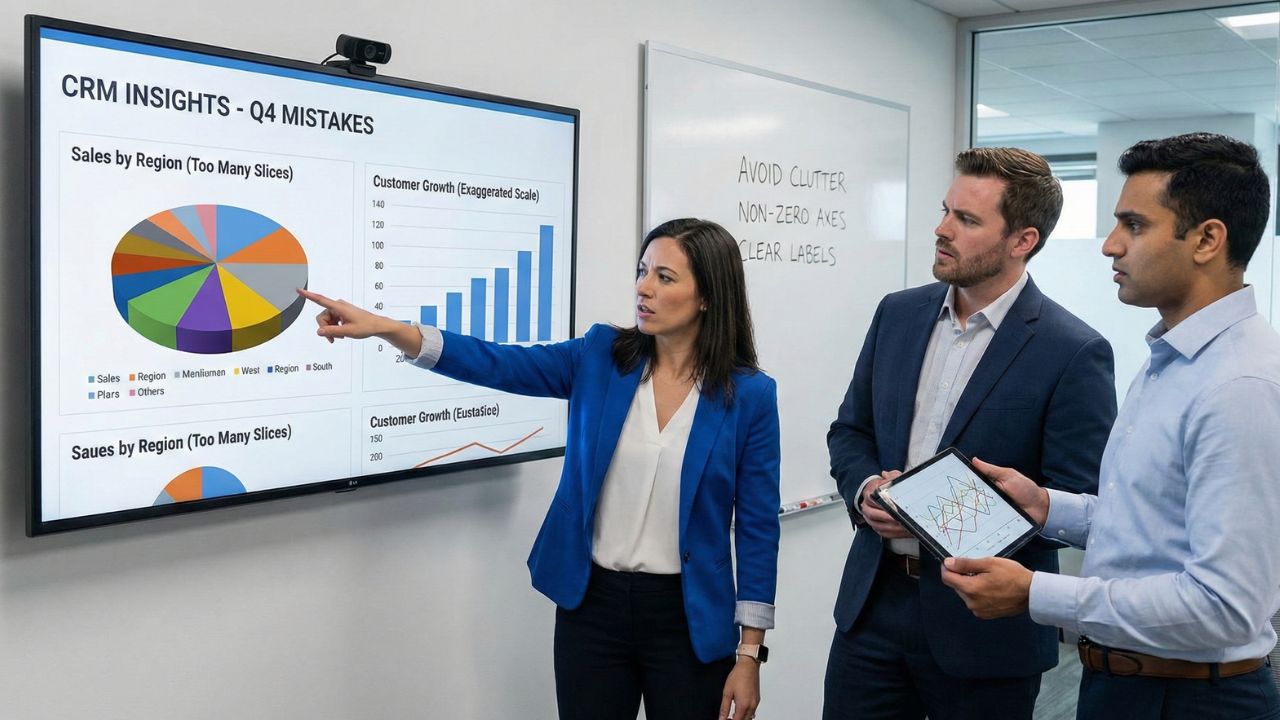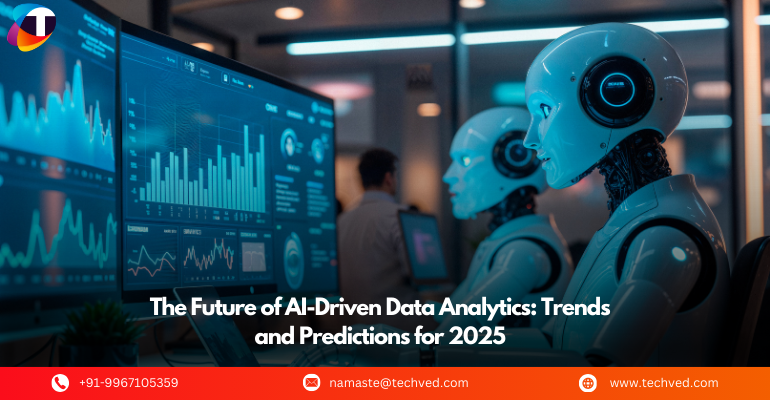


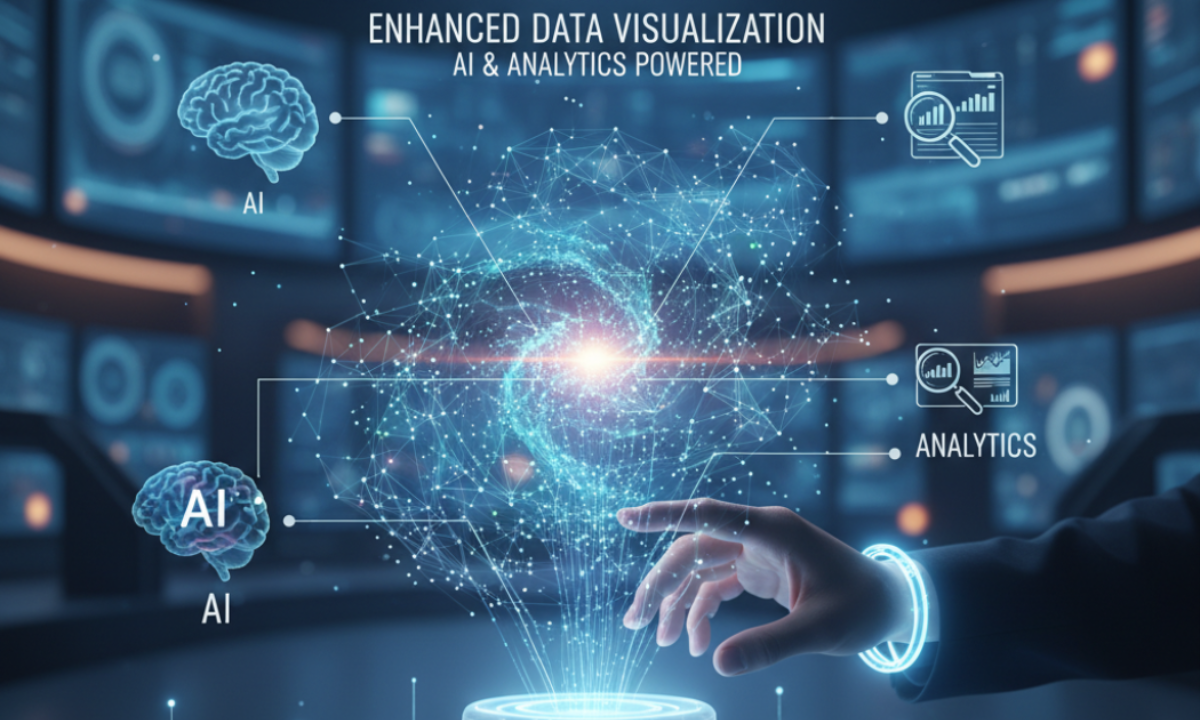
In today’s fast-paced digital world, businesses generate massive amounts of data daily. While data visualization has traditionally helped present complex information in understandable formats, the integration of Artificial Intelligence (AI) and advanced analytics takes it to the next level. By uncovering hidden patterns, predicting trends, and personalizing insights, AI and analytics significantly improve the effectiveness of data visualization.
Transforming Raw Data into Actionable Insights
Data visualization simplifies complex datasets using charts, graphs, and dashboards. However, AI-powered analytics allows businesses to move beyond simple representation. AI algorithms can process large volumes of structured and unstructured data in real time, identifying patterns, correlations, and anomalies that may not be obvious at first glance.
This capability transforms raw data into actionable insights, enabling organizations to make informed decisions faster. By visualizing complex relationships within data, businesses can proactively identify opportunities and potential risks, rather than reacting after problems occur.
Predictive Analytics for Smarter Decisions
One of the most significant contributions of AI to data visualization is predictive analytics. By analyzing historical data using machine learning models, businesses can forecast future trends and behaviors.
Interactive dashboards can display these predictions visually, helping decision-makers understand potential outcomes at a glance. For example, AI-driven sales dashboards can highlight upcoming market shifts or changing customer preferences, allowing companies to adjust inventory, marketing campaigns, and pricing strategies effectively.
Personalized and Adaptive Visualizations
AI enhances data visualization by providing personalized and adaptive experiences. Intelligent dashboards can automatically adjust based on user roles or preferences. Executives may see high-level summaries, while analysts can explore detailed, granular data with interactive drill-downs.
This adaptability ensures that stakeholders at every level can access relevant insights quickly, reducing cognitive load and improving decision-making efficiency.
Automated Insights and Anomaly Detection
AI also powers automated insight generation and anomaly detection, alerting users to critical trends and outliers without manual intervention. This capability is especially valuable in sectors like finance, healthcare, and manufacturing, where early detection of irregularities can prevent losses or improve outcomes.
Automated visual alerts help businesses respond promptly to operational inefficiencies, fraud, or other emerging risks, saving time and resources while maintaining high efficiency.
Enhanced Accessibility and Engagement
Modern AI-driven visualizations improve accessibility and engagement for all users. Tools with Natural Language Processing (NLP) enable users to query dashboards using simple language. Additionally, AI can transform data insights into intuitive visual stories, guiding users through complex datasets in a more understandable and engaging manner.
This combination makes data actionable for non-technical stakeholders while boosting confidence in decision-making across the organization.
Conclusion
The integration of AI and analytics with data visualization transforms how businesses interpret and act on data. By providing actionable insights, predictive forecasts, personalized dashboards, automated anomaly detection, and improved accessibility, AI-powered visualizations allow organizations to make decisions faster, smarter, and with greater confidence.
In the current digital landscape, combining AI, analytics, and data visualization is not just a competitive advantage; it is essential for unlocking the full potential of business data.