


Statistics suggest that more than half of a company’s revenue comes from 8% of its customers.
Businesses employ a lot of strategies that help them retain customers. These activities include but are not limited to:
- Understanding their customers to serve them better,
- Giving them personalized offers,
- Customizing their search and purchase experiences
According to a report released in 2020, US companies lost more than $35 billion due to unpredictably high churn rates.
But why did it happen despite employing lots of customer retention tactics?
The answer is simple: the retention tactics weren’t based on data.
In this guide , we will explain how you can collect qualitative user data that will help you measure and improve customer retention rates.
How to measure customer retention? With KPIs.
First, let’s start by understanding the important customer retention KPIs (key performance indicators).
Focus on these four crucial customer retention KPIs to measure customer retention.
Customer retention rate is the number of customers that keep buying from you after a given period of time. For instance, if you get 100 customers on day one, and have 25 customers remaining on day 30, your monthly customer retention rate is 30%.
Customer churn rate is the percentage ratio of the number of customers at the start of a time period to the number of customers at the end of a time period.
Revenue churn rate is the percentage of revenue loss your business has incurred from existing customers in a period of time. The revenue from new customers is not taken into consideration while calculating the revenue churn rate.
Net Incremental Revenue is the change in net revenue of a business after running a campaign, while also considering the cost of the campaign. It is a great way to calculate the effectiveness of a customer retention campaign.
Now we have understood what customer retention KPIs we need to track. Next, let’s understand how to collect the data. This data lets you calculate your KPIs and improve customer retention.
How to improve customer retention? By cohort analysis.
Cohort analysis refers to the process in which you segment your users or customers on the basis of various parameters. This enables you to answer specific questions that help you predict user behavior and reduce churn.
There are two kinds of cohorts you can create which will help you run a churn cohort analysis.
Acquisition cohort – It will help you learn how the customer found you. This will help you scale up your marketing efforts selectively helping you reduce acquisition costs.
Behavioral cohort – It will tell you how they use your product and interact with your website providing you with practical ways to improve the UX (user experience).
Now, let’s take a look at how you can collect the relevant data to build these cohorts which will help you track relevant customer retention KPIs.
Acquisition cohort – surveys
The most preferred way to know how a customer/user came to know about your product is by asking them. Many products integrate it during the onboarding tour but it can be a bad idea since it slows down the sign-up process, affecting the user experience.
The best time to ask it is after a user signs up and tries the product. After a user signs up for your product, you can send them a link to a survey via their preferred form of communication and request them to fill it up.
While creating a survey that will help you learn more about your customer, keep the following tips in mind –
- Ask clear questions. Keep the language simple.
- Multiple choice questions and true/false questions have better response rates.
- Don’t make the survey too long.
- Use a template that speaks your brand language.
- Frame the questions in your audience’s tone and language.
How do I conduct this extensive survey campaign?
You can’t measure and improve your customer retention manually. Rely on a robust tool for this. We made Webmaxy as the go-to user-behavior research suite. One of its brilliant features is its survey campaign management.
Some key features:
Webmaxy offers 250 survey templates for many industries
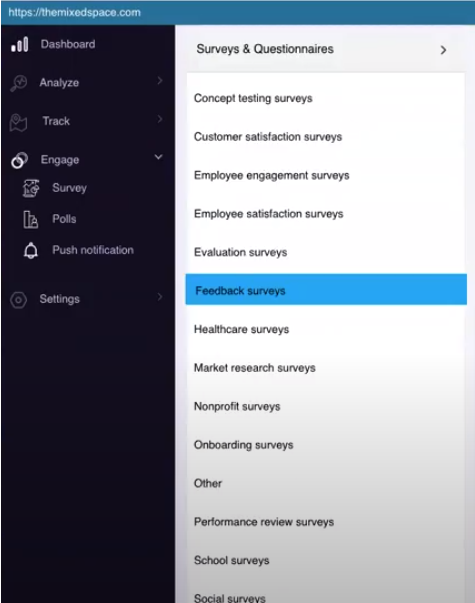

- Webmaxy automatically creates graphical acquisition cohorts
- You can export the results for offline analysis
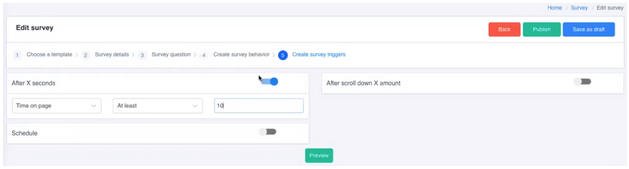
- You can control when the survey pops out in a user browsing session
This information lets calculate the customer acquisition cost (CAC) for each marketing channel.
Behavioral cohort – live recording and heat maps
What is the best way to see how a user interacts with your product than to record it?
Live recording of a user’s behavior on your website or product will help you answer the following questions:
- Which features are liked/disliked the most by your users?
- Where do your users get stuck while using your product?
- What are the content pieces that get the most attention?
- Where do your users click?
Through the answers to these questions, you will learn more about your target audience and how you can develop your product in a desirable direction.
Webmaxy’s analyzer tool records your users’ live interactions and creates behavioral cohorts such as heat maps and click maps. Through these cohorts, you will have definite answers.
Guide your product development team to
- Remove roadblocks and improve the UX.
- Improve the website
- Create content that your target audience loves
Measure and improve customer retention, with Webmaxy
Customer retention strategies reduce churn. However, employing those strategies without the guidance of qualitative data is a wastage of resources. To properly measure and improve you customer retention, you need to know two things:
- How your user found you. This will help you improve your marketing efforts.
- What do they like in your website and product? This will give you a direction for growth.
Webmaxy helps you measure and improve customer retention using qualitative data in a simple and cost-effective way.


The key to customer satisfaction is implementing successful customer retention strategies.
If you don't carry out these strategies you'll lose your most valuable and profitable assets... your customers.
Develop a schedule or calendar of customer retention calls and follow it!
Sometimes a phone call or email will suffice, to simply check up on delivery, billing, and so forth.
However, don't forget the face-to-face call.
As a salesperson, you represent your company to your customers.